My burning question is this:
How do I know when to sell and when to buy?
I’m glad I started my newbie investor journey with small amounts of money, because my white-collar bets NOW feel more like purchases my kids made in-app on Club Penguin.
Why? Because NOW I have less money than I started with and just watch little line-graph displays on my phone for entertainment. YIKES.
I believe many investors are experiencing this, with the Crypto heist of $150million this weekend and just basically awful things happening in the world. What to do?
Common sense says to wait until my stocks come back up before selling…but the part of me with no real knowledge or training wonders…well, then if it’s going up, should I keep it? Or will it just go up and down and down? How do I make any money?
Also, boring ol’ common sense tells me that the world is in chaos, and the market maybe isn’t great this week.
And what about crypto? At what point do people who made money on this actually sell it to have money? I’m not talking about the super wealthy who can keep and borrow against it to live lives of luxury…what about the people who are making profits in just the thousands? Or the tens, like me.
Learning about this is actually great for forcing me to look to the future and crash course something new WHILE I’M NOT DOING ANYTHING AT ALL with my stocks and crypto. I’m calmly calling this “holding”.
A term came up during my latest self-start, newbie investor crash course: Candlestick Charts. (Like when one influencer exclaimed, “Watch the candlesticks!”)
I hear this term all the time. What are they? How to read these in a way that help a person determine when to buy, sell, or hold? I don’t know.
I looked it up.
Aaaaaand this term is bonkers.
This is a little beyond newbie investing, but I feel like I should get an idea of what this means.
Basically, and I mean super-on-the-surface, candlestick patterns show price movement for a stock.
There are books about this, entire theories based on dozens of patterns. This is like religion for investors. Deeply. I’m going to try to understand this more as I go, and hopefully it will guide my decisions better than me guessing.
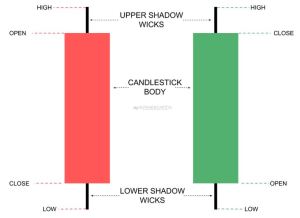
I found a helpful website (that I have no affiliation with, just like it) with simple language on this: https://www.alphaexcapital.com/candlestick-patterns/. Simple language like, “The beauty of candlestick chart patterns is that anyone can use them. They are perfect for all levels of experience…” Also, there is an extensive “Candlestick Cheatsheet” near the end of the post plus a GIF from “The Office” so I’ll be back to alphaexcapital.com for more. Plus, this super-clear illustration:
From another website, investorsunderground.com, I picked up what was for me the most concise surface explanation of candlestick charts,
“The candlestick data summarizes the executed trades during that specific period of time. For example a 5-minute candle represents 5 minutes of trades data. There are four data points in every candlestick: the open, high, low and close. The open is the very first trade for the specific period and the close is the very last trade for the period. The open and close is considered the body of the candle. The high is the highest priced trade and low is the lowest price trade for that period.
The high is represents [sic] by a vertical line extending from the top of the body to the highest price called a shadow, tail or wick. The low of the candle is the lower shadow or tail, represented by a vertical line extending down from the body. If the close is higher than the open, then the body is colored green representing a net price gain. If the open is higher than the close, then the body is colored red as it represents a net price decline.” (https://www.investorsunderground.com/stock-charts/candlestick-charts/)
Maybe I should just blog about wandering around these investing websites. You know, I could do this all day, every day, and STILL not learn it all. I did find that I could switch my viewing preference on my Robinhood app to candlestick charts instead of a line graph, so that should hasten my ability to recognize patterns.
Investorsunderground.com has a useful “candlestick charting simulator”, free for 14 days, so if it doesn’t require a credit card number, I will try it out and get back to y’all.
